By Antonia Kaz
While preparing for a presentation or writing a manuscript, you may find yourself in a position of information overload especially considering stringent time and space limitations. Thankfully, figures can decrease the time spent presenting your results and make your manuscript more succinct. A well-designed figure provides a quick and simple representation of your ideas and findings to scientific and non-scientific audiences. They are the hook of publications, grabbing your readers’ attention and potentially convincing them to read beyond the figure. A carefully designed figure is like an illustration that helps convey a story, promoting your work across numerous research fields. Figures that “stand alone” or clearly inform the audience of the major findings without captions or the full manuscript are ideal. Misconstrued conclusions drawn from a poorly-labeled figure, taken in or out of context, plague the dissemination of buzz-worthy research findings from high-impact journals. Thus, figures must be clear, intuitive, informative, and robust to misinterpretation.
On June 6th, 2023, the iJOBS workshop series hosted a figure design specialist. The founder of Figures First Consulting, Sarah Treit, Ph.D., is an expert in data visualization, writing, and editing scientific research. In her iJOBS workshop, she impressively demonstrated her keen ability to identify flaws in a figure and teach others how to do the same. The workshop was an interactive lesson on manipulating graphs and tables to magnify key findings and avoid misinterpretation. For your convenience, this article provides the major takeaways, resources, and tips to improve your figure design process that were discussed during the workshop.
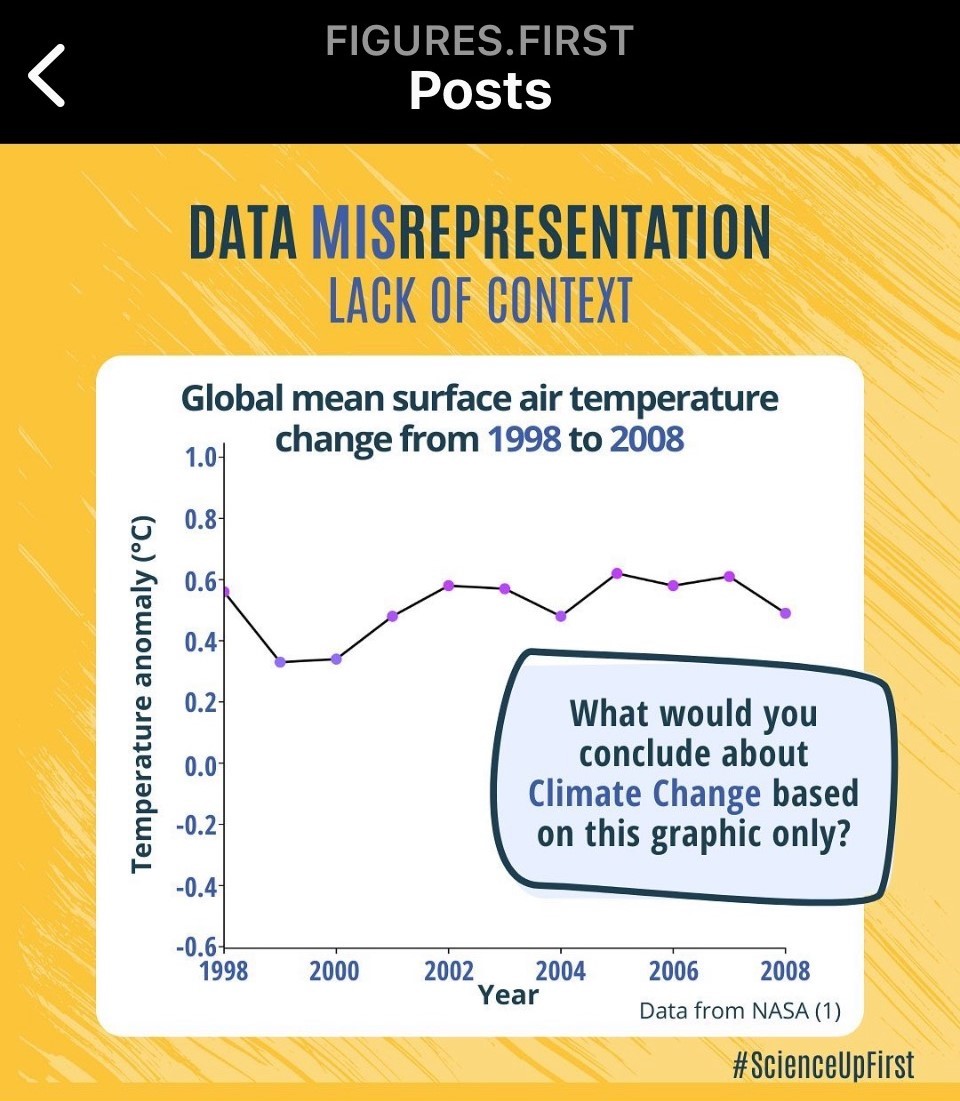
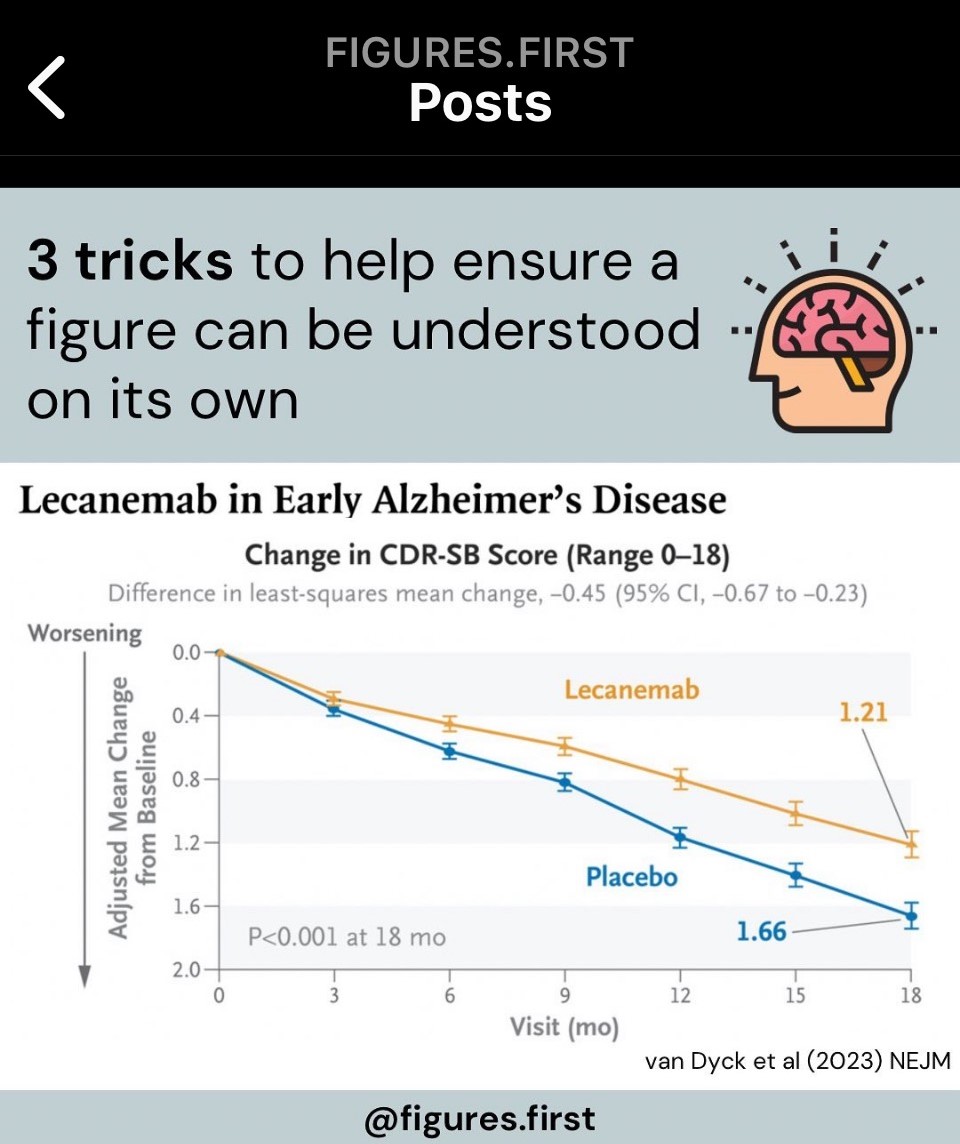
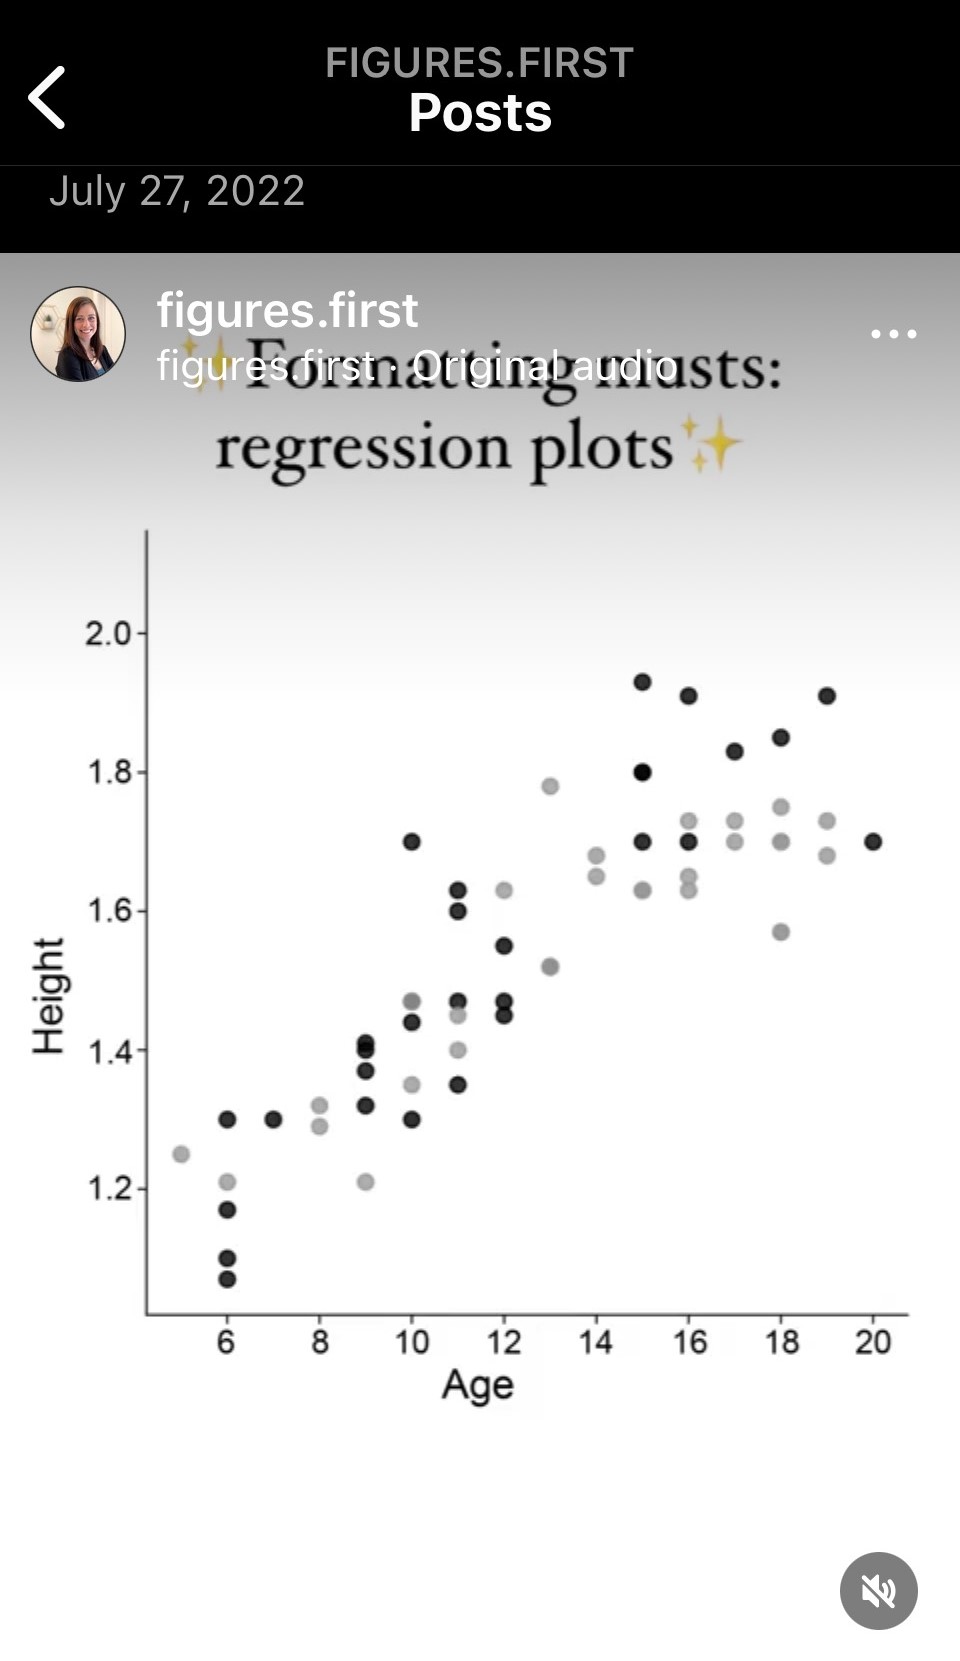
Figure design is an iterative process involving multiple steps. The workshop provided advice for the preparation and editing phases of the figure design process, including determining your audience, highlighting key information, improving the appearance of figures produced on your software of choice, and receiving and implementing feedback. Determining your audience is the first and most essential part of the preparation phase. A presentation for experts in your field should be drastically different than a presentation for a non-scientific audience. Although, keep in mind that the audience may change if the research becomes newsworthy or goes viral on social media, and consider how to alter your figure to avoid misinterpretation by your audience. Providing descriptive axes and informative titles with clear take-home messages, rather than allowing the viewer to determine it, can avoid data misinterpretation. Additionally, highlighting the key results via colors or arrows can help emphasize the major findings within a figure.
The Figures First website and Instagram are excellent sources for learning tricks and tips to create well-designed and compelling figures. In just five minutes, you can learn to make your grant figure more aesthetically pleasing, easier to interpret, and fit within your manuscript without exceeding the page limit. In addition to these freely available sources offered on the website, there is a course called The Fundamentals of Effective Figure Design for Academics and other workshops that teach effective figure design.
The figure design process can often be lengthy. It is best to begin early to ensure ample time for review. You may find yourself taking breaks, stepping away from the figure design process, and returning within a day or two with a clear mind or a new objective for the figure. Dr. Treit encourages this! When you return to the design process, ask yourself, “Why am I showing this data in particular?” and “Which conclusion or take-home message does this figure provide evidence for?” Once you have completed the editing phase, ask your co-authors and colleagues for their opinions through “blinded tests.” Start by asking someone who knows the methods and results, e.g., a lab member, friend, or co-author, to describe your figure in their own words, without reading the caption, to ensure that their interpretation matches your take-home message. Then, repeat the same with a colleague or maybe an undergraduate student in your lab. Potential misinterpretations will be salient.
The information Dr. Treit provided applies to any preferred software applications; however, she recommends using the same program while performing statistical analyses and designing figures. If your statistical analysis is done in GraphPad, the graph components of your figure should be as well. Whether you are a figure design novice or an experienced research publisher, there is always room for improvement. Be sure to check out the resources provided by Figures First when you start the figure design process!
This article was edited by Senior Editor Natalie Losada and Senior Editor Sonal Gahlawat.